Insights platform for 'data-driven' organizations
Introduction
This article is about organizations becoming more “data-driven”.
It is about how organizations can transform and its workforce make better decisions using data first and intuition second.
How can a highly diverse and segmented workforce, make more and better decisions by combining their knowledge with access to data and technology? How can the learned insights be put to work and reused across the organization? What role should Information Technology (IT) departments play in this “data-driven” transformation?
Although every organization journey in becoming data-driven is unique and multi-faceted, in my experience, there is at least one aspect that can accelerate and bring clarity during this journey across all organizations. In this article I will focus on that aspect and propose a set of digital services, forming a centralized platform open for decentralized contributions, further called Insights platform or simply platform.
In a spectrum that begins in letting everyone ‘do their thing’ and ends in centralizing everything in IT, this article defends a position in the middle that allows individuals to quickly put their knowledge to work wherever they are in the organization while allowing IT to maintain safeguards, manage and bound the complexity of the underlying technology stack.
Why is this important?
Although the promises and pursue of a ‘data-driven’ transformation are not new in organizations 1 2, in my experience, these organizations, and their partners, often struggle to organize the data and technology components into meaningful digital services that enable this transformation.
A great amount of focus is often given to technology patterns (e.g. data lakes, lambda/kappa architectures) and processes (e.g. Agile) but unfortunately, in my experience, these don’t empower enough the organizations individuals and teams, and often end up as a simple rebrand of existing processes and artifacts.
Below are some real examples, from my experience, on how organizations fail to empower their workforce to make better decisions using data.
As an employee, I understand a part of my organization business and I need to look at relevant data. I quickly discover, that data is stored away in a database protected by IT. After I build a business case and convince someone for access I get a database export with terms and relationships I do not understand, I reach out to DB admins. After four months I’m finally looking at data I can understand.
… data is stored away in a silo … I get an database export with terms and relationships I do not understand … after four months I’m finally looking at data I can understand.
As an employee, I have relevant data but need tools (and compute) to analyze it. I find through a colleague, they are using a tool that would fit my needs. Their setup took three months and spanned licensing, infrastructure, security controls and a lot of meetings with IT. I would have to go through the same, so I just use a trial version of the tool on my laptop.
Their setup took three months and spanned licensing, infrastructure, security controls and a lot of meetings with IT … I just use a trial version of the tool
As an employee I find a colleague in a homologous department in another country has created a solution that would be a great fit for my department. They have a team of developers, I need to staff, and reengineer my colleagues solution. I don’t know what to do.
I need to staff, and reengineer my colleagues solution. I don’t know what to do.
The platform should strive to remove these hurdles and abstract away much of the complexity of bringing data, tools and intellectual property to the employee.
Related topics
Data Warehousing and Business Intelligence
Almost every organization has one or multiple data warehouses of some sort. Whenever you have one or more systems where data comes into existence and someone wants to perform aggregations on that data, you will find one.
The biggest consumers of this are people in front of a Business Intelligence (BI) tool connected to the Data Warehouse. They are typically looking back in time on different aspects of the organization (e.g. financial, orders, incidents, customer, etc).
Both the Data Warehouse and BI tool working together allow someone who understands nothing of the underlying complexity in the organization data and systems to be able to create, view and share, among other tings, the revenue of the organization grouped by its products.
Although their prevalence and longevity are a testament to its success recently cracks appeared, the first is they struggle to service users with increasing technical and analytics skills looking for more then reporting. The other one is because it treats all data as having the same value its costs tend to scale exponentially.
Data Lake(s)
The acumen from the Hadoop ecosystem showed that cheap compute and storage could tackle the explosive data growth in organizations. Vendors quickly jumped to monetize this new trend under the moniker of Data Lake with the motto “hoard all the data and the users will come”.
Even though the term Data Lake is so fuzzy to the point of meaninglessness, its motto combined with low upfront costs proved very attractive for IT managers. Enterprise architects also jumped in the latest tech trend and data lake initiatives spread like wild fire.
As unaltered copies of data landed in Data Lakes, end users were left scratching their heads on how to interpret the data and left, turning the lake into a graveyard. IT workers struggled with applying security controls on files creating copies of copies to perform things like row-level security, turning the lake into a swamp.
Most organizations have since realized their data lake makes much more sense encapsulated by their existing Data Warehouse and have reaped some of it’s benefits, namely how to deal, in a cost effective way, an increasing amount of data.
Embedded Analytics
The idea to bring analytics capabilities to employees existing tools and processes is called embedded analytics.
In reality the approach is simple, pay a bit more for whatever software your employees are already using (e.g. Customer Relationship Management (CRM)) and overnight add analytical powers to their existing flows and processes. Employees have to switch less between tools and purchasing changes are minimal or even consolidated in fewer vendors.
The biggest drawback is, if the organization relies too much on this approach, their data strategy will, for the better or worse, soon be completely coupled to it’s vendors. Although this might be fine in supporting areas of the business, for the business areas creating a competitive advantage the risk exposure can simply become too high. What if the vendor becomes too expensive? What if we need other capabilities? What if they go bankrupt?
Agile IT
Agile values for software development 3 and it’s frameworks (e.g Scrum, Kanban) have long crossed their origins to being applied to entire IT departments.
The trend of moving to software what can be achieved in software 4 has put tremendous pressure in IT departments. IT departments typically seen as a supporting area of the business, focusing on stability, predictability and well defined processes are now having to deal with a demand that changes often, fast and in some cases pushing what the industry has to offer.
Although IT can profit from Agile values and its frameworks, applying them top down without providing new services to a changing demand from employees, often ends in IT running the same processes using a slightly different vocabulary. Hardly a compelling return-on-investment.
Insights Platform digital services
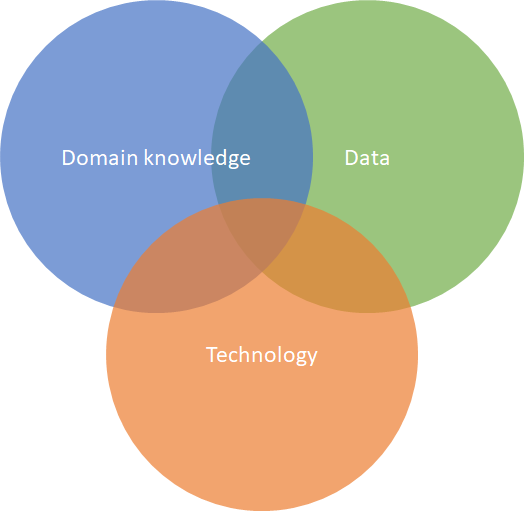
For individuals and teams to have a data based approach to decision making at least three needs must be met. Domain knowledge, data and technology.
|
|
|
The platform will require them to bring the domain knowledge they already have and will focus on serving the other two areas, data and the technology.
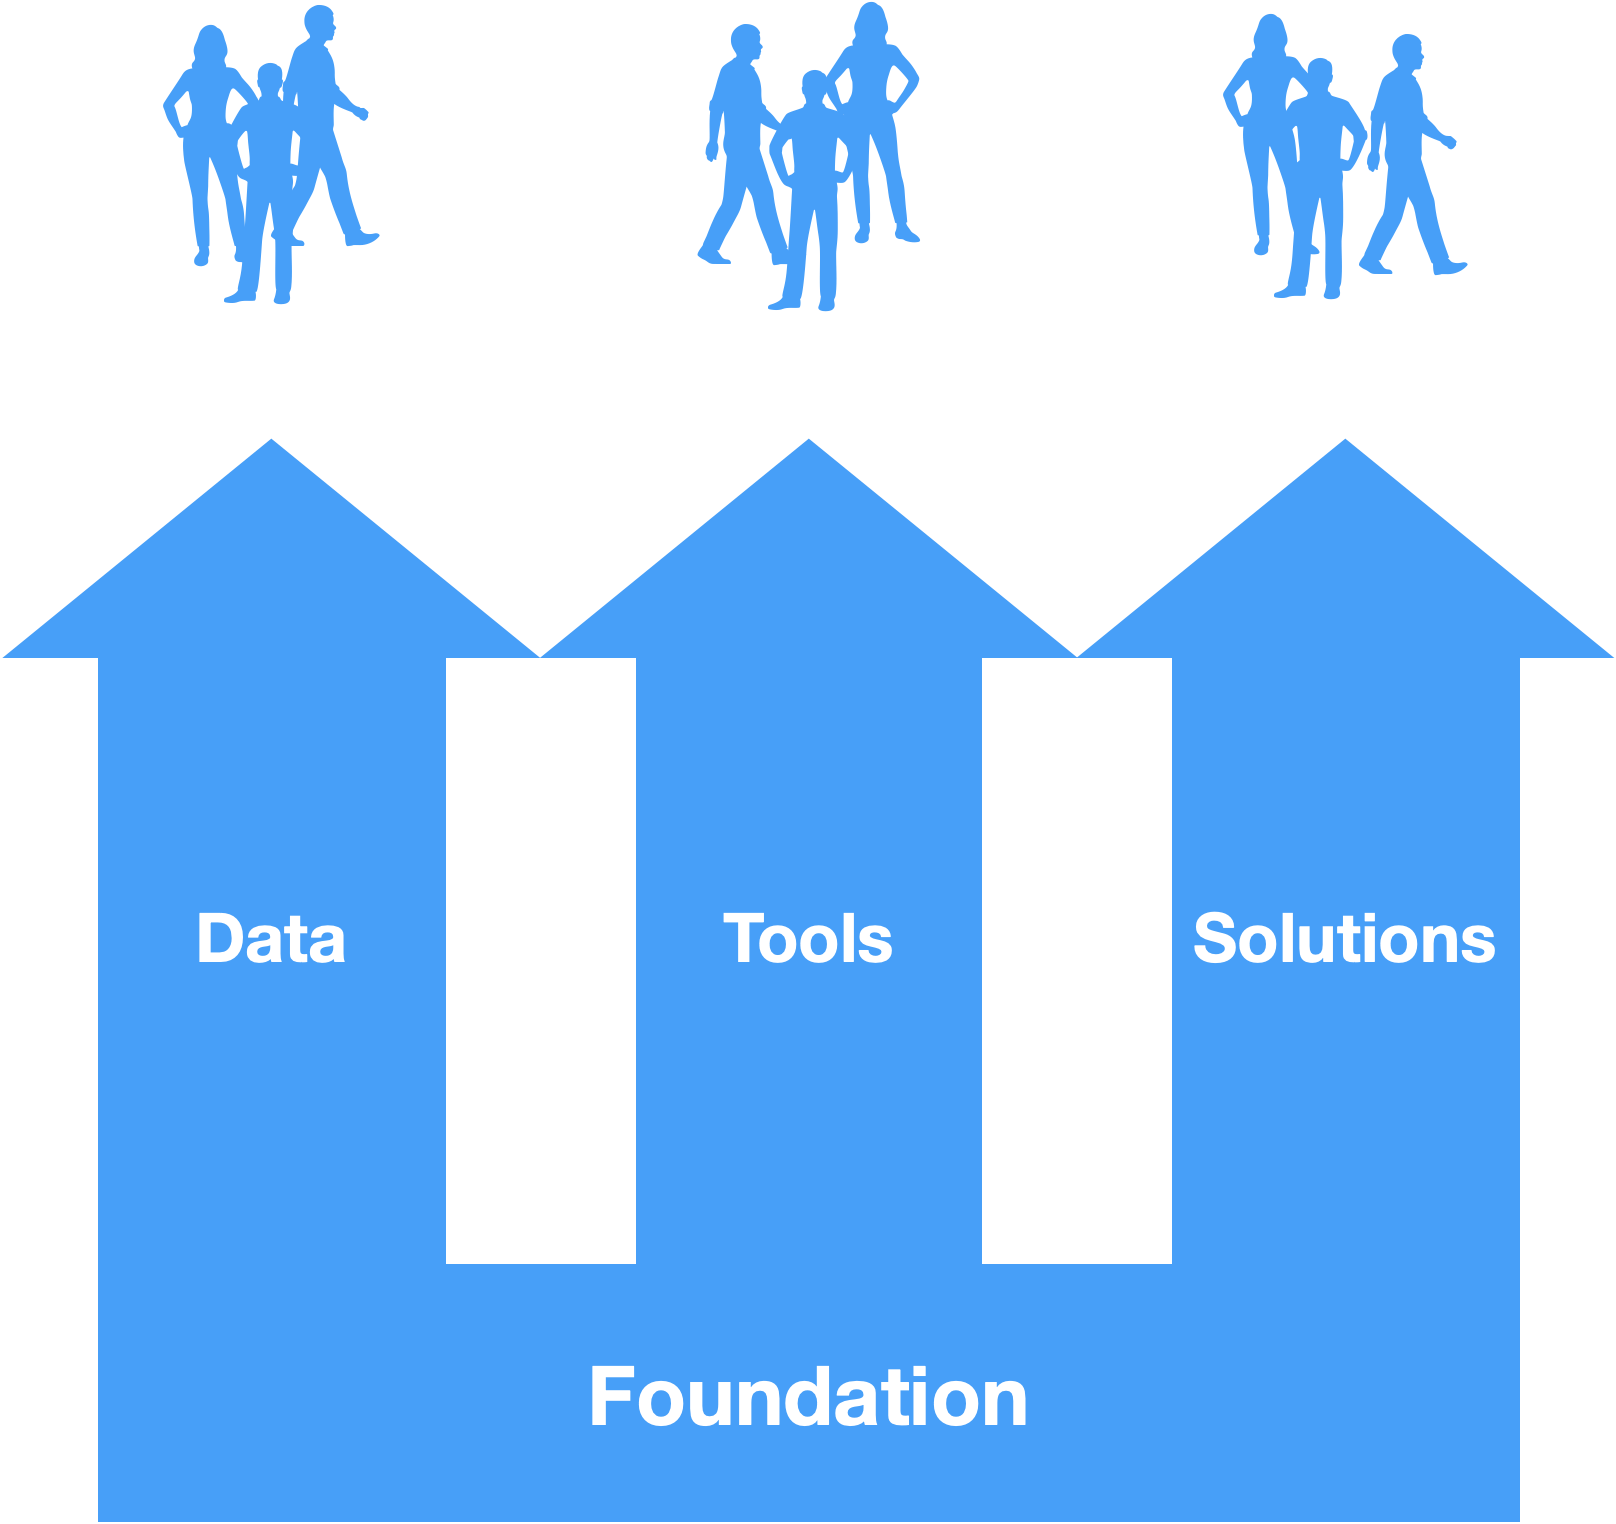
These areas will be translated into three services resting in a common foundation.
|
|
|
The Data (as-a) service provides access to high value, integrated and interpretable datasets anywhere in the organization.
The Environments (as-a) service provides on-demand creation of environments with provisioned and configured technology for common workloads. The workloads should allow people to discover new insights, prototype ideas and create new solutions.
The Solutions (as-a) service provides reuse of the IP created in the platform with everyone in the organization through the form of managed multi-tenant solutions.
The foundation will be the result of the infrastructure, controls and processes created by the platform team to support the platform digital services. This should be the by-product of creating the services and not a goal in of itself.
Data
The data (as-a) service must deliver, first and foremost, high value data using, as much as possible, terms and relationships captured from the language used by the workforce and made available through interfaces, that are usable by tools available to that workforce.
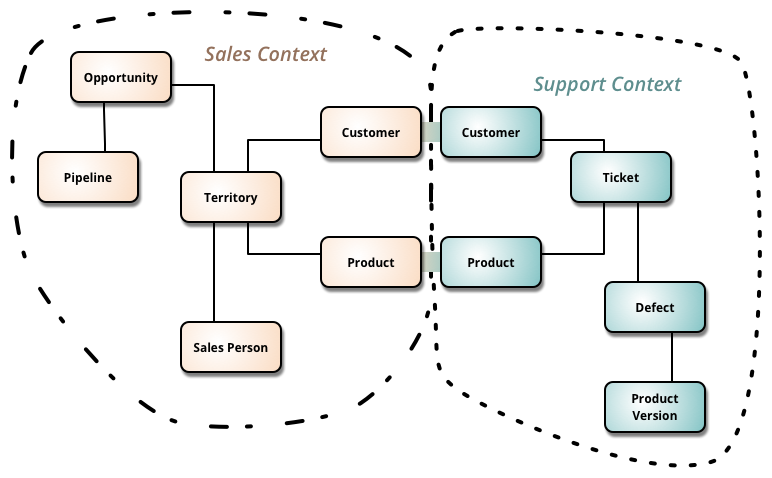
Because there are multiple correct and overlapping ways to describe data so must we. This service will consist of, possibly overlapping, sets of data, or datasets, each holding data in very narrow contexts of the organization. A context is often a sub-domain in the organization delimited by business units or teams.
This is very much like Domain Driven Design (DDD) approach to break down very large models filled with ambiguity and sometimes conflicting terminology to smaller domain models living in bounded contexts tackling narrower domain problems 5.
|
|
|
The argument for multiple models is that by having domain experts (workforce) and data modelers share the same language in narrower sub-domains, it becomes easier for the domain experts (workforce) to consume data from these models and for the modelers to work independently from each other in different domain areas.
At the core of each dataset is a model and its persistence to a storage medium in a highly normalized form. Around the model are the mechanisms by which that model is both filled with data (pull/push, streaming/pooling, ETL/ELT, etc.) and made available for consumption (XMLA, SQL, Parquet, normalized/denormalized etc.).
This approach is similar to the ports and adapters pattern 6, illustrated below, for isolating application logic and infrastructure. The motivation is to enable the development of the models to be decoupled from the ever evolving transactional systems and end-user tools.

|
|
|
- Yellow: Data model including its storage implementation and medium. (e.g. logical model and it’s third normal form on SQL)
- Red: Interfaces specifying how the model is filled with data and make data available for consumption
- Light Blue: Implementation of the interfaces that bring data from outside systems into the model (e.g ETL filling all customers from transactional SQL database).
- Dark Blue: Implementation of interfaces for data consumption (e.g. XMLA with denormalized sales results).
Although the owners of this platform are always accountable, implementation responsibility can be in other parts of the organization closer to the context in question.
Tools for metadata management, cataloguing and lineage can work next to these datasets to help employees find the appropriate dataset, location, provenance.
On the topic of who fills these models with data, the owners of the platform can take one of two approaches.
- Connecting to systems of data as they are and bringing the data to the models is part of implementing the service.
- Implement an interface for ingestion and push the responsibility of connecting, mapping and pushing data into the model to other parts of the organization.
Both approaches scale differently as you would expect for heterogeneous landscapes of data systems.
Environments
The Tools (as-a) Service should provide quick access to (software) tools, that anyone in the organization can use to discover new insights and apply them in creating new solutions.
To this extent organizations do well in leveraging the built-in scalability and automation from cloud computing providers in quickly delivering and managing a wide selection of tools.
The access to tools happens through the concept of an environment. An environment is a logical place where tools are, or can be, provisioned, and which lifecycle is tied to a project. In this context a project simply means there is either time or money allocated for an individual or team to pursue the solution of a problem using data. These environments must therefore be created quickly and on-demand by the workforce, and destroyed without affecting each other. All the tools in an environment, regardless of where they physically are, are deployed, managed, supported and decommissioned as one.
Regardless of which tools are in these environments, all environments should include (foundational) non functionals like:
- Access to the organizations identity provider
- Connectivity to relevant systems of data
- Monitoring
- Chargeback
- Security controls
For a tool to be available in these environments it must meet only two requirements: i) can the tool be integrated with these non-functionals (above)? and ii) can professional support be offered through a (internally) unified support process?
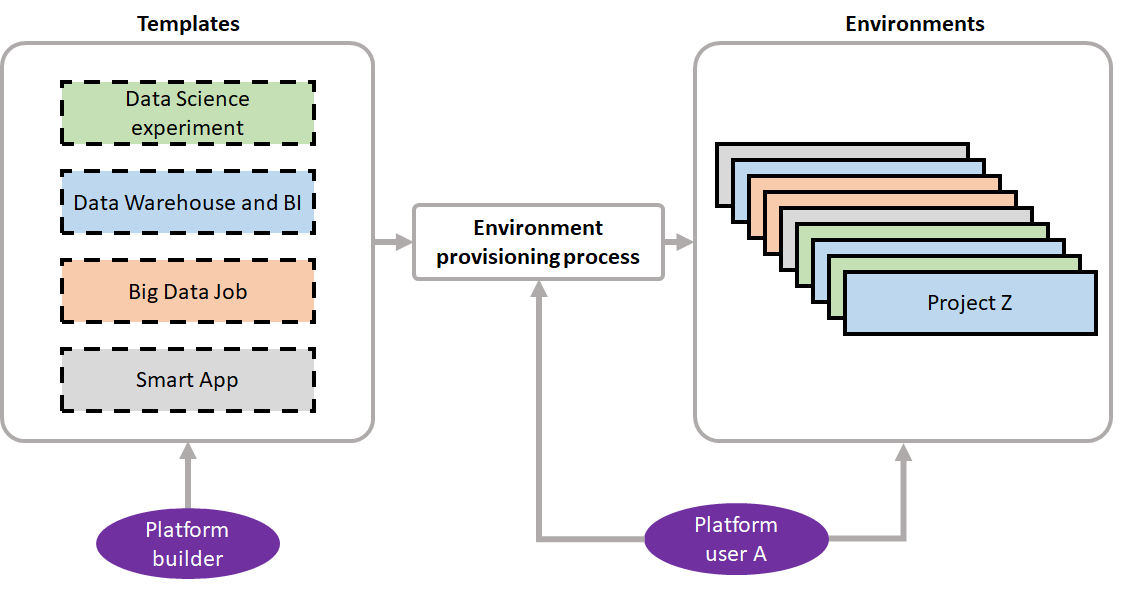
Tools can either come provisioned and configured in the environments or the environments allow the employee to self-service that provisioning and configuration. Although the second approach can work well for tech-savvy employees, the first approach can speed up significantly the work of tech-savvy and non tech-savvy employees alike. To this extent the platform offers multiple environment types that cater to different workloads reoccurring often in the organization.
Below are examples of workloads I find often in organizations:
-
Data Science experiment: Extracting insights from structured or unstructured data, typically applying scientific processes and techniques from multiple disciplines like operational research, data mining, statistics, machine learning, artificial intelligence and others. Typical outcomes are i) document of experiment with findings, methodology and conclusions, ii) Optimized plan that minimizes some cost function and/or iii) a trained model that can do inference on new data to some level of accuracy. Such experiments include finding correlations, performing sensitivity analysis, signal processing, forecasting, image processing, classification, finding latent structures to name a few.
-
the Data Warehouse and BI solution: Extracting, integrating, mastering and modeling data from operational data stores for further data analysis and/or visualization, often through Business Intelligence (BI) software. Typical outcomes of such a solution are financial or sales dashboards and monthly reports.
-
the Smart Solution: Development of a custom solution that puts to work an insight discovered using data. Often the place where predictive models from data science experiment are put to work. Custom developed smart solutions can, for example, lower customer churn through better targeted campaigns, predict asset failure to maximize uptime of manufacturing processes, increase safety in workplace by using automatic hazardous conditions in video footage.
-
the Big Data Job: Applying transformations and or aggregations to high volumes of data. Often used tools include Apache Hadoop ecosystem software (e.g. Apache Spark) or other map-reduce orchestration software on “commodity” machines and networking, where low to no communication between worker nodes is needed. Examples of big data jobs include: applying and storing a linear transformation to 1PB of images or parsing, joining and querying 20TB of log files.
-
the High Performance Computing Job: Running complex calculations where low latency communication between worker nodes is necessary. Typically run on specialized hardware using, for example, InfiniBand standard and/or Graphical Processing Units (GPUs). Examples include a wide range of physics simulations to test the design of new boat parts, genome sequencing, autonomous driving and deep learning.
-
Workflow Automation: Automating workflows and business processes to reduce manual, error prone, work and/or speed up the flow of data in an organization. Traditional workflow automation development tools and Robotic Process Automation tools are relevant in this space.
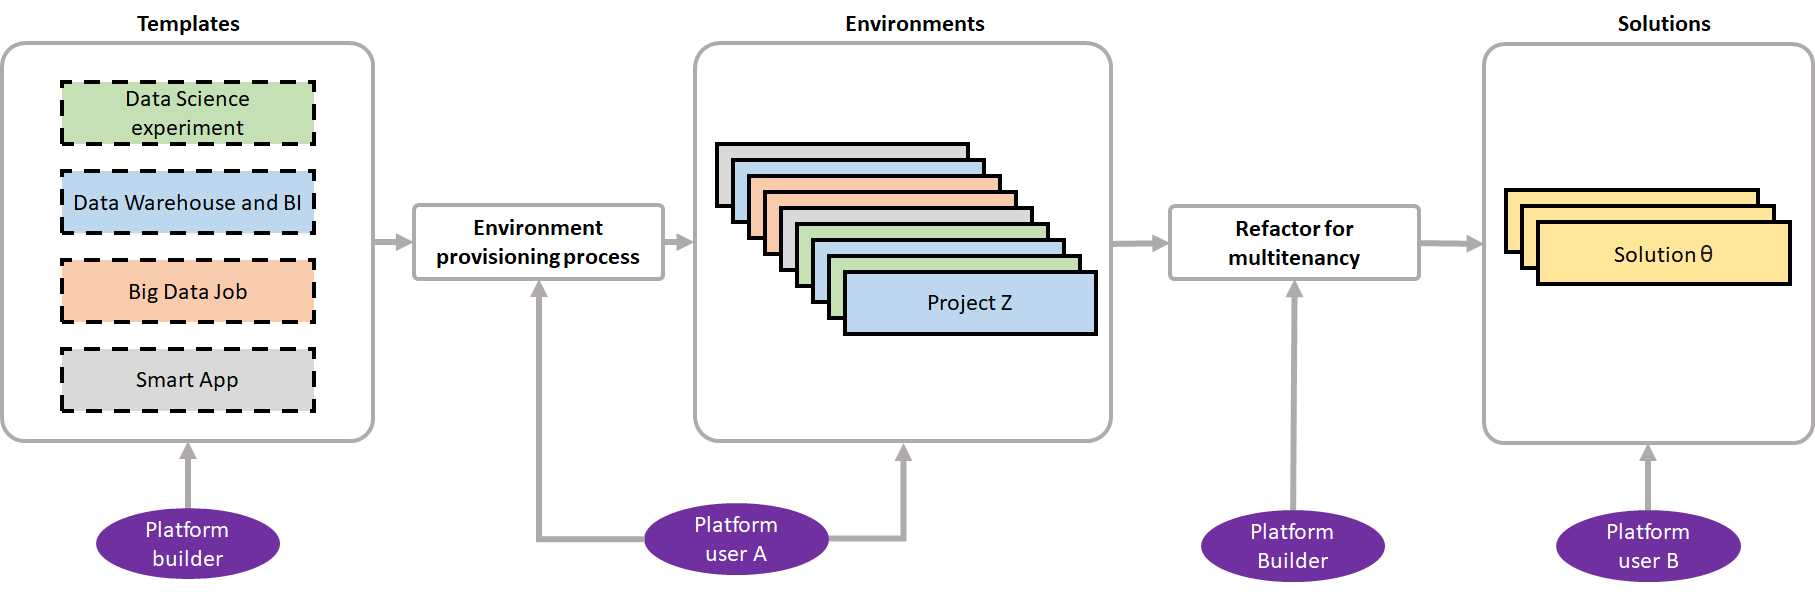
The act of requesting a new environment, to perform a workload, can happen through a website and the provisioning made fully automated by the use of templates, specifying all the infrastructure and configuration as code. The figure bellow illustrates the process.
|
|
|
Solutions
The Solutions (as-a) Service should speed up the reuse of intellectual property (IP), created in the platform.
The key in speeding up the reuse of IP, is by transferring the ownership of support and further development from the employee to the platform owners, allowing for different budgeting and sourcing scales.
|
|
|
As part of this transition, re-hosting the IP in shared infrastructure allows for i) lowering running costs and ii) scale support for application and infrastructure separately. An example of such re-hosting would be moving all solutions IP during the transition to containers (e.g. Docker) and a container orchestration tool (e.g. Kubernetes).
Another change in this transition would be making these solutions multi-tenant and creating interfaces and documentation on how new teams in the organization can open a new tenant space and onboard their own data.
Final remarks
Having a workforce that makes better decisions using a data first approach is more then having a platform. Strong leadership, change management, great support, sourcing and partners are all just as important.
Nevertheless an organization culture is the net behavior of its workforce. and they must be served with different propositions if we expect them to perform their work leveraging data. This has been the focus of the article.
References
-
Data-Driven Transformation: Accelerate at Scale Now, Boston Consulting Group May 23rd 2017 Link ↩
-
Three keys to building a data-driven strategy, Mckinsey March 1st 2013 Link ↩
-
Why Software Is Eating the World, Andreessen August 20th 2011 Link ↩
-
Ports And Adapters Architecture, Alistair Cockburn 2006 Link ↩